
Watch the mechanism, not the average
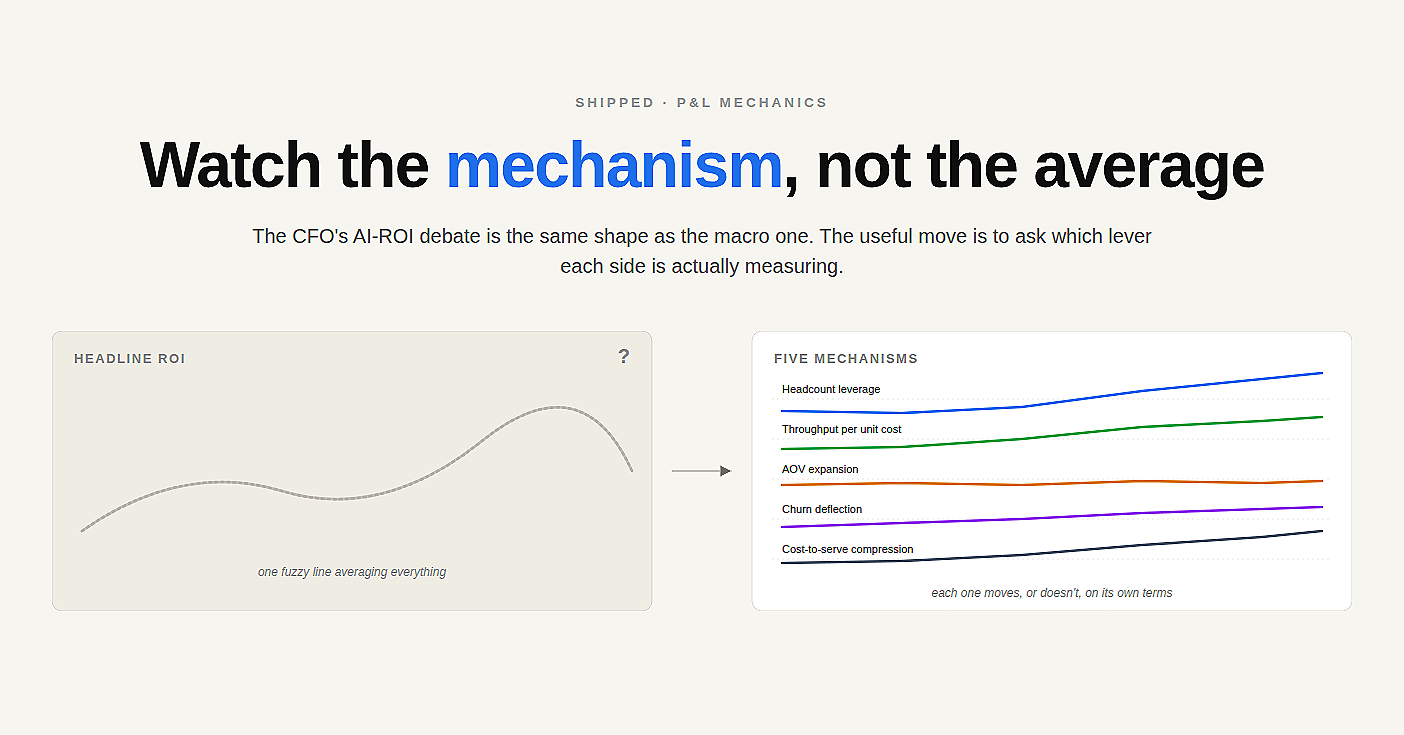
The CFO’s AI-ROI debate is the same shape as the macro one. The useful move is to ask which lever each side is actually measuring.

There is a $$$-dollar gap between the most optimistic and most pessimistic forecasts for AI’s contribution to GDP over the next decade. The serious people writing those forecasts — Nobel laureates, NBER working papers, central banks — are not arguing about whether AI is impressive. They are arguing about which mechanism is doing the work.
Will AI be confined to “easy” tasks while real value sits in “hard” ones? Can institutions absorb capability fast enough to convert it into output? Will AI eventually automate the production of innovation itself?
The useful move, as AI Frontiers framed it last week, is not to average the optimists against the pessimists. It is to identify which mechanism each forecast is implicitly betting on, then watch the empirical signal for that mechanism.
That same trick works one altitude down. Inside companies, the AI-ROI debate has the same shape. Optimists wave “calls deflected” and “hours saved.” Pessimists wave vendor invoices and complain nothing has shipped. Both sides are averaging. The interesting question — the CFO question — is which P&L mechanism the AI investment was supposed to move, and whether you can construct a counterfactual clean enough to tell whether it did.
There are roughly five mechanisms worth tracking. Each one needs a different counterfactual, a different measurement discipline, and a different vanity metric to watch out for.
The vanity-metric problem
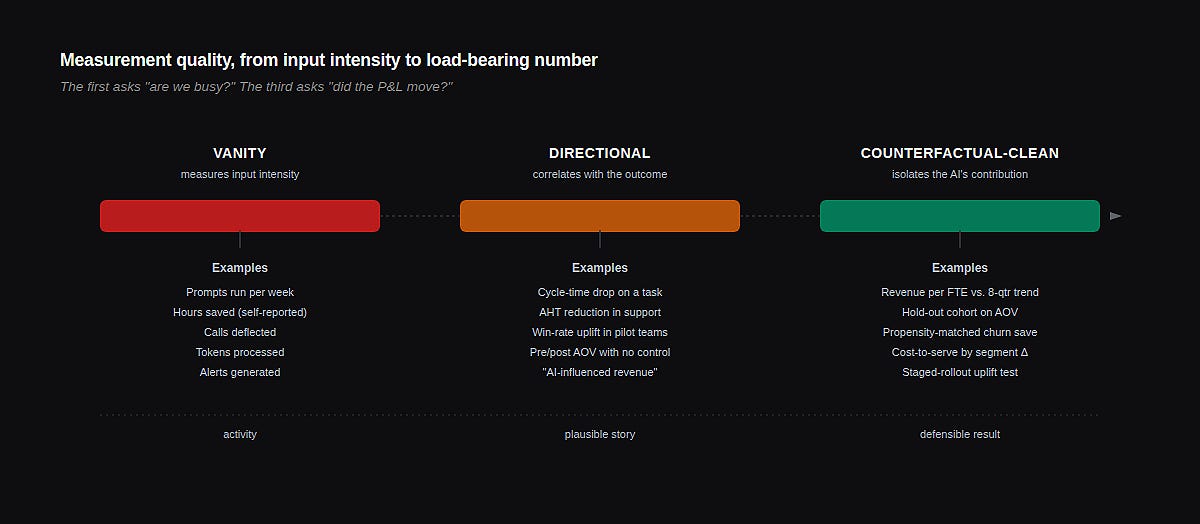
A vanity metric in AI work isn’t always wrong. It’s usually true. The problem is that it isn’t load-bearing for the P&L. Calls deflected by a chatbot is a real number. So is prompts run per week, time-to-first-byte on RAG, accuracy on a held-out test set. None of these tells your CFO whether the headcount curve is bending, whether contribution margin is widening, whether the cost to serve a dollar of revenue has fallen, or whether anyone is renewing because of the AI work.
The vanity metric isn’t a lie. It is an input-intensity measurement masquerading as an output-value measurement. The two get confused because the AI program team produces the dashboard, and they reasonably measure what they have shipped.
A useful CFO move is to pre-commit, at program start, to which P&L mechanism the work is supposed to move — and to a measurement design that could in principle show it didn’t. If the dashboard cannot show failure, it cannot show success.
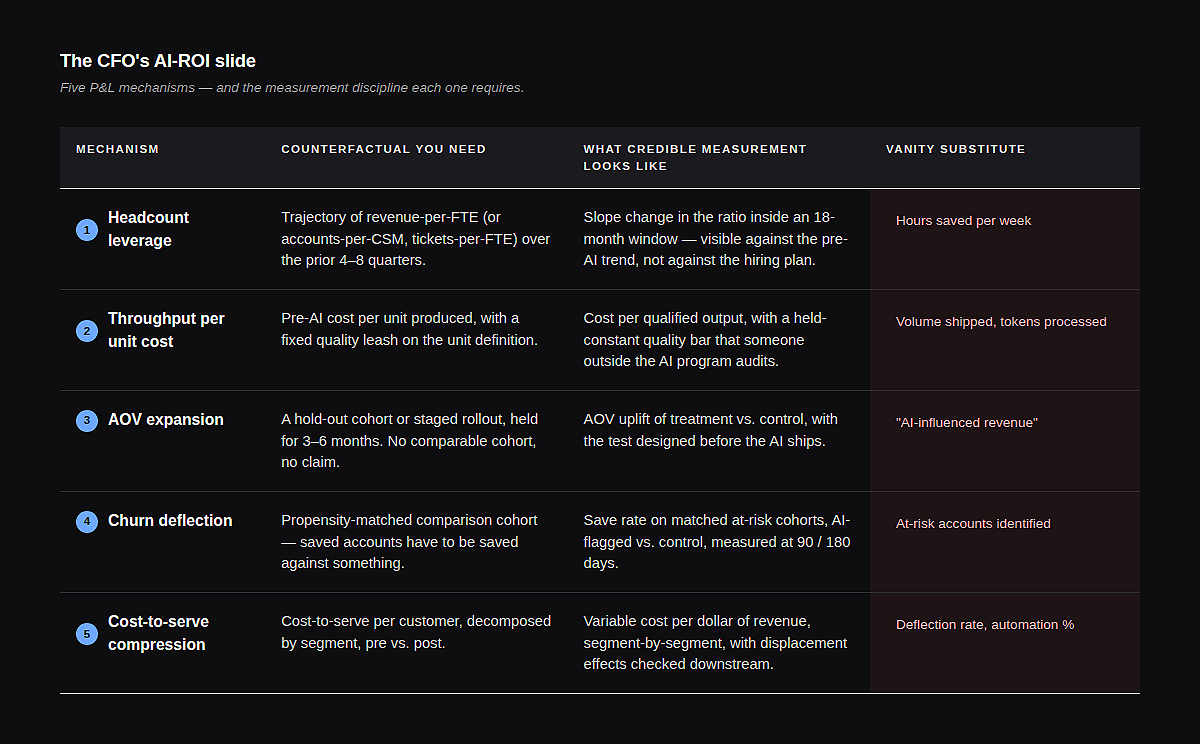
The five mechanisms
1. Headcount Leverage
The bet: AI lets you grow revenue without growing the team proportionally — or shrinks the team without losing throughput. Ratios bend.
The counterfactual is harder than it looks. Most “AI saved us N hires” claims are constructed against a hiring plan that was always aspirational. The plan said sixty engineers; you ended at forty-eight; therefore AI saved twelve hires. Maybe. The slope of actual revenue-per-FTE over the previous four to eight quarters is a much stricter judge. If you cannot show the slope changing inside an eighteen-month window, the leverage isn’t there yet.
The vanity substitute: “hours saved per week.” Saved hours don’t bend the ratio unless they’re aggregated into a hire not made, an attrition not replaced, or a span-of-control expansion. Most saved hours get absorbed into Slack.
2. Throughput Per Unit Cost
The bet: AI compresses the cost per unit of work produced — articles, code reviews, qualified leads, sales debriefs, claims processed.
This is the cleanest of the five, because the unit is concrete. Pre-AI cost per qualified lead versus post-AI cost, with the lead-quality definition held constant. The trap is quality drift. AI-assisted output is often subtly worse, or subtly better, on a dimension nobody is measuring, and the cost-per-unit number is meaningless without a quality leash that someone outside the AI program owns.
The vanity substitute: tokens processed, or content pieces shipped. Volume is not throughput. If the marginal piece does not get used, you have burned compute, not compressed cost.
3. AOV Expansion
The bet: AI in the workflow — recommendation, configuration, sales enablement — increases what the average customer buys, either on first transaction or over the relationship.
The counterfactual requires a hold-out or a staged rollout, and most companies skip it because it feels slow. The result is a correlational claim that AOV rose during the quarter the AI shipped — which also happened to be the quarter pricing changed and new packaging launched. Hold out a meaningful cohort for three to six months, or accept that the AOV claim is a story.
The vanity substitute: recommendations served, or “AI-influenced revenue” — a metric usually defined so generously that any deal touched by a model-generated email counts.
4. Churn Deflection
The bet: AI surfaces churn signals early, routes interventions, and pulls accounts back from the edge that would otherwise have left.
This is the most counterfactual-hungry of the five mechanisms, because the saved accounts did not churn. There is no event to point at. Credible measurement looks like a propensity-matched cohort, where AI-flagged-and-intervened accounts are compared against statistically similar accounts in a control period or geography. Anything less is a chart of accounts that stayed — most of which would have stayed anyway.
The vanity substitute: alerts generated, or “at-risk accounts identified.” Identification without a clean save rate against a control is just a louder dashboard.
5. Cost-to-serve compression
The bet: AI in support, ops, or back-office work reduces the cost of serving a unit of revenue. Contribution margin widens because the variable cost of each customer falls.
The counterfactual lives in the unit economics of the customer segment, not in the AI program’s budget. Cost-to-serve per customer per month, decomposed by segment, so you can see whether the cheap-to-serve customers got cheaper (often noise) or the expensive ones got cheaper (often the real prize). Then check downstream — deflection that pushes the same problem into an outbound call a week later isn’t compression, it’s displacement.
The vanity substitute: deflection rate, average-handle-time reduction, automation percentage. Each is a leading indicator. None is the P&L number.
How the slide actually gets made
The work isn’t picking the right metric. The work is the design discipline before the program ships: declaring which mechanism you expect to move, what would falsify the claim, and what data infrastructure has to be in place six months before you can read the result.
Most AI programs skip this and pick a metric retrospectively, after the dashboard exists. That is how “calls deflected” became the dominant industry KPI — it was the number the system already produced. Working backwards from instrumentation guarantees vanity output, because instrumentation is built to confirm activity, not value.
If the dashboard cannot show failure, it cannot show success.
The CFO’s leverage is asking the question early: What is the mechanism, what is the counterfactual, and when will I see the signal? The right answer to all three forces program design that produces a load-bearing number. The wrong answer — or no answer — means twelve months from now you will be staring at a dashboard full of token throughput and politely worded executive summaries, with no honest way to say whether the bet paid off.
The five mechanisms read on different clocks
One reason vanity metrics dominate is that they read fast. Calls deflected shows up the day the bot ships. Revenue per FTE takes four quarters before the slope is legible. CFOs and program sponsors who don’t pre-agree on the time horizon end up substituting the fast number because it’s the only number available at the review.
Throughput per unit cost is the quickest of the five to settle, often within 60 to 90 days, because the unit is concrete and the comparison is direct. Cost-to-serve compression reads in roughly a quarter to two quarters, longer if you want to confirm the savings aren’t being eaten by displacement downstream. AOV expansion needs three to six months of hold-out cohort data before the uplift is statistically distinguishable from a packaging change or a seasonal effect. Churn deflection is slower still — the matched-cohort save rate is rarely credible inside 180 days, and a year is more honest. Headcount leverage is the longest read of all: the slope of revenue-per-FTE rarely shifts visibly inside twelve months, and the eighteen-to-twenty-four-month window is where the bend, if it exists, becomes legible.
This matters because the temptation is always to ship five AI initiatives at once, declare them collectively transformational, and then pick whichever mechanism reads first as the proof point. The discipline is the reverse: name which mechanism each initiative is meant to move, accept the clock that mechanism requires, and don’t substitute a fast vanity number when the real signal is still arriving.
What this looks like in practice
The headline ROI question is the wrong altitude. It averages mechanisms that move on different clocks, against counterfactuals that don’t exist, into a single number designed to defend the budget rather than test the bet.
Drop one altitude. Pick one or two mechanisms the program is genuinely supposed to move. Build the counterfactual before you ship — even a rough one beats none. Accept that the credible measurement will be slower, uglier, and less generous than the vanity number. Then watch the slope.
The macro debate about AI and GDP will not be settled by averaging the forecasts. It will be clarified, if it is clarified at all, by watching the empirical signal for each mechanism each forecast bets on. Wage gaps across occupations. Capital reallocation rates. Automation of R&D productivity. The load-bearing observations.
The CFO version of this fits on one slide. Most companies don’t have that slide yet. The ones that build it first won’t necessarily have better AI — they’ll just be the only ones who can tell.
The author is an AI Engineering Leader, helping Enterprise finance, revenue, and operations teams ship AI into production — and measure whether the bets actually paid off. Keen to engage !